Every market page publishes the numbers behind its offer. See the math
Home › Guides › The Real Cost of Every Month Your House Sits on the Market
Guide
The Real Cost of Every Month Your House Sits on the Market
A listing that doesn't sell right away isn't free to hold onto. Every extra month costs real money in mortgage interest, property tax, insurance, and upkeep — and it usually comes with a price cut too, since buyers get suspicious of listings that sit. None of that shows up on the sign in the yard, but it shows up in your net proceeds.
Takes about two minutes. Or call
(313) 710-6129 — we answer.
Educational only. This explains how these situations generally work. It is not legal, tax or financial advice, and the rules differ by state — talk to an attorney or CPA about your own situation before you act on any of it.
The cost of a house sitting on the market: the short answer
A typical house costs roughly $1,000 to $1,300 a month to carry while it's listed — mortgage interest, property tax, insurance, and basic upkeep — and the longer it sits, the more likely it is to need a price cut. In February 2026, a record 34.2% of U.S. home sellers had already cut their asking price, per Redfin. Combine carrying costs with a price cut and a listing that takes several months to sell can net less than a cash offer would have, even though its eventual sale price is higher.
This is educational information, not financial advice. Carrying costs, typical price-reduction patterns, and market conditions vary by property, loan, and location — run your own numbers with an agent or lender before deciding.
What it actually costs to hold a listed house each month
Mortgage interest (on a $150,000 balance)
~$800/mo
Property tax
~$200/mo
Homeowners insurance
~$120/mo
Utilities and basic upkeep
~$140/mo
Total
~$1,260/mo
That's a hypothetical breakdown on a $200,000 house with a $150,000 mortgage balance — your own numbers will differ based on your loan, your tax rate, and whether you're still living in the house or carrying it vacant. What doesn't change is the principle: none of these costs pause just because your house is listed instead of sold.
The part most sellers don't price in: the odds get worse the longer it sits
Buyer psychology shifts the longer a listing sits unsold, and current market data backs that up. According to Redfin, 34.2% of U.S. home sellers cut their list price in February 2026 — the highest February share on record — and among sellers who cut, the average reduction was 7.3% of the original price. Redfin also reports a median 49 days to sell as of mid-2026, up from prior years. A listing sitting past that median is, by definition, taking longer than most of its competition to find a buyer.
We see a similar pattern in our own transaction data across the markets we buy in — median time-on-market before a sale ranges from around two weeks in some Rust Belt neighborhoods to seven weeks or more in others, and the houses that sit longest are disproportionately the ones that needed a price correction to finally move. The CFPB's homeownership resources cover the broader cost side of carrying a home through a sale, including how mortgage, tax, and insurance obligations continue regardless of listing status.
The honest math: when waiting stops paying off
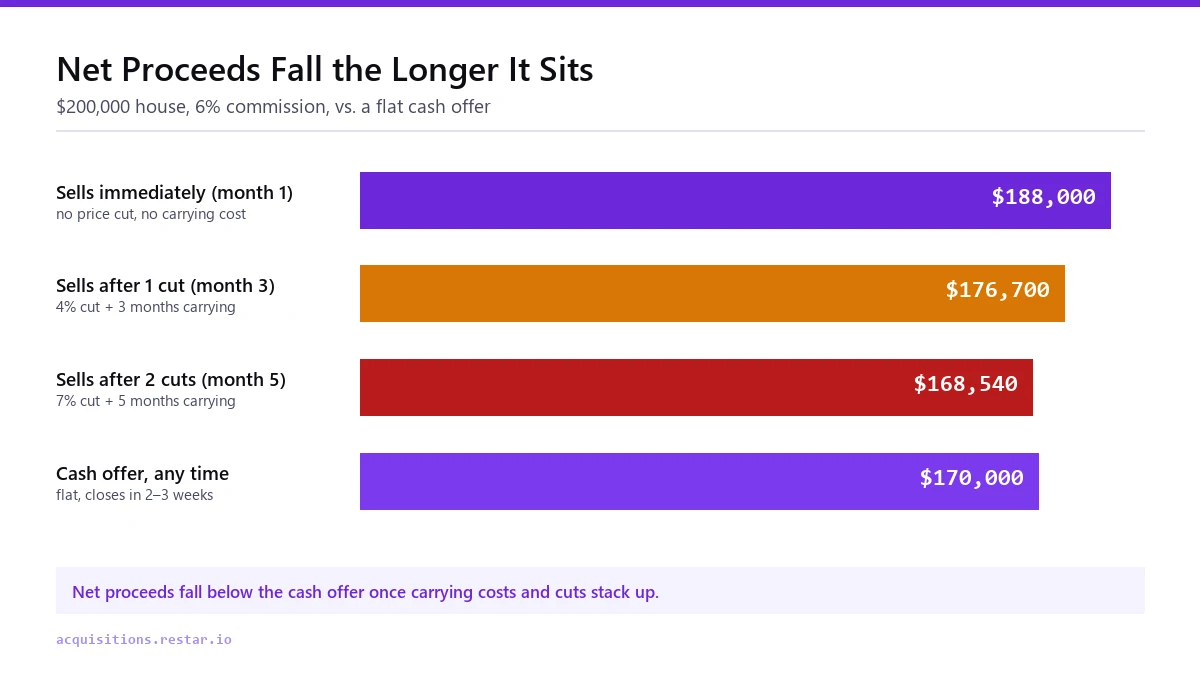
Take a $200,000 house and a hypothetical $170,000 cash offer available today — a discount reflecting no commission, no repair negotiations, and a close in two to three weeks instead of months. Compare that against a retail listing at three different points:
Scenario
Sale price
6% commission
Carrying cost
Net proceeds
Sells immediately (month 1)
$200,000
$12,000
$0
$188,000
Sells after one price cut (month 3)
$192,000
$11,520
$3,780
$176,700
Sells after two price cuts (month 5)
$186,000
$11,160
$6,300
$168,540
Cash offer, any time
—
—
—
$170,000
Net proceeds fall below the cash offer somewhere around month four or fiveRestar Acquisitions · worked example from this page
A worked illustration on one hypothetical property with a flat cash offer for comparison. Not a quote, not a prediction about your house, and not a fixed formula we apply — actual price cuts, carrying costs, and cash offers vary.
The pattern that matters here isn't the exact dollar figures — it's the crossover. A listing that sells quickly beats a cash offer by a wide margin. A listing that drags on for months, taking price cuts along the way, can end up netting less than the cash offer it started out beating. Where your specific house falls on that curve depends on how it's priced and how your local market is moving right now.
What actually reduces this risk
Price it right from day one — overpricing by even 3–5% is the single biggest driver of a listing sitting long enough for this math to turn against you.
Get a pre-listing inspection — surfacing problems before you list avoids a mid-process price renegotiation on top of a slow sale.
Set a real deadline with your agent — decide in advance what days-on-market or price-cut threshold triggers a serious conversation about alternatives.
Consider renting it out — if the market is genuinely soft, carrying it as a rental instead of a stale listing can beat both options.
Take a cash offer if certainty matters more than maximizing price — especially if you can't absorb several more months of carrying costs.
Common questions
How much does it really cost to keep a house on the market?
A commonly cited range is $1,000 to $1,300 a month once you add mortgage interest, property tax, insurance, and basic upkeep, though your specific numbers depend on your loan balance, tax rate, and whether the house is occupied or vacant.
Do homes really sell for less the longer they sit?
Generally yes. Redfin reported that 34.2% of U.S. sellers cut their list price in February 2026, the highest February share on record, and sellers who cut priced an average of 7.3% below their original asking price. Listings that sit longer are disproportionately the ones taking a cut.
At what point does a cash offer beat a slow listing?
It depends on your specific numbers, but as a rule of thumb: the more months a listing sits and the more price cuts it takes, the closer its eventual net proceeds move toward — and can fall below — a cash offer that could have closed months earlier.
Should I just price my house low to sell fast?
Not necessarily. Underpricing sacrifices value you might have captured with a correct price; the goal is pricing accurately for current market conditions, not artificially low. An agent with current local comps is the right resource for that call.
Does a cash offer expire while I'm deciding?
That depends on the specific buyer. Ask directly how long any offer you receive stays valid before you use it as your comparison point.
What if my house has already been sitting for months?
Re-evaluate the price against current comps rather than assuming your original number was right, and weigh the remaining likely carrying cost and further price-cut risk against a cash offer available today. Both are legitimate paths depending on your finances and timeline.
The math changes the longer a house sits — that's the whole point of this page
A well-priced listing that sells in the first few weeks usually beats a cash offer on pure dollars. The math shifts as carrying costs and price cuts stack up the longer it sits. Send us the address and we'll run your actual numbers against a cash offer so you can see where you stand today, not where a generic average says you'd stand.
If your listing is fresh and priced right, that's usually still the better path — we'll say so.
Every offer on this site is underwritten by a person, not a form. If the
numbers do not work for you, say so and I will tell you what would.
Also from Restar
Want the data behind all of this?
Restar Acquisitions is the acquisitions arm of Restar — a housing-market analytics
platform tracking 180+ metrics across every U.S. market, with composite scores and 12-month
price forecasts. The numbers on this page come from the same work.